Read in Other Languages
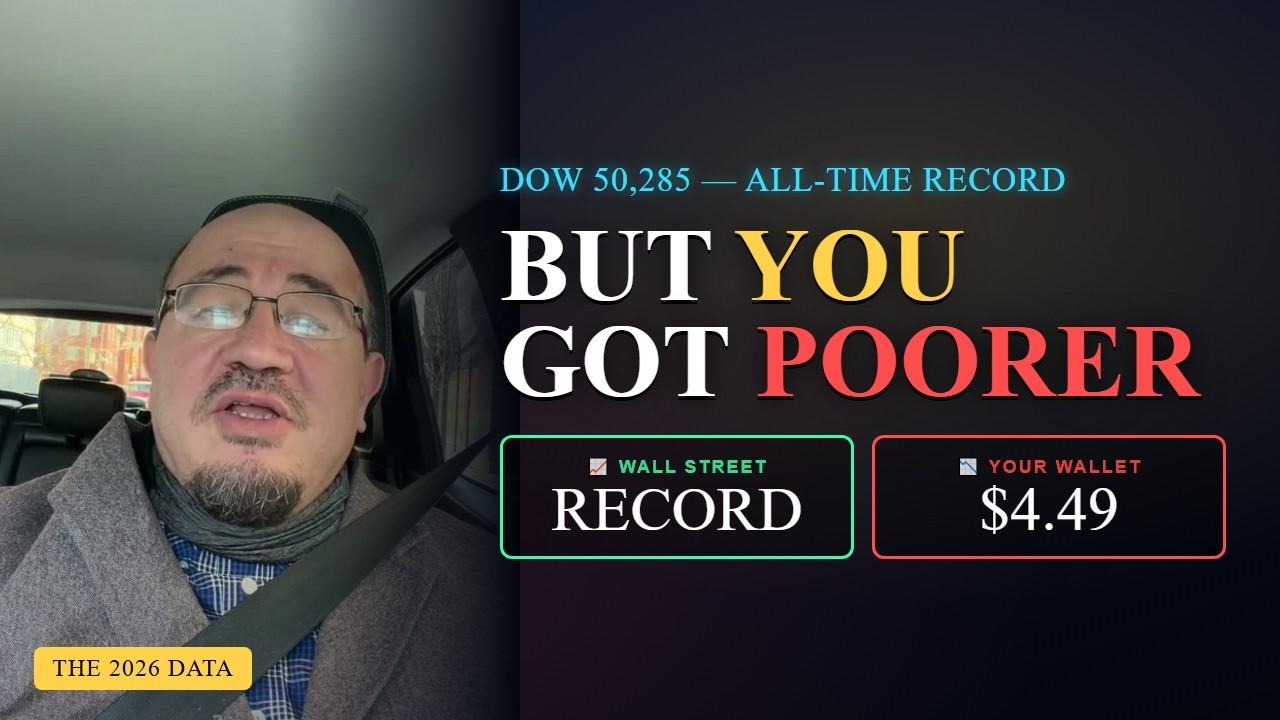
On the same day, in the same economy, two numbers told opposite stories. The Dow Jones closed at an all-time record — 50,285. And a gallon of gas hit $4.49. One screen was throwing a party; the other was a household quietly going broke. So how can both be true at once?
This isn't a glitch in the market. It's the surface of a shift that took thirty-five years to build — and a war in early 2026 simply pulled back the curtain on it.
The Elephants Danced
There's an old proverb: when elephants fight, the grass gets trampled. In 2026, the elephants weren't even fighting — they were dancing. On February 28th a war broke out; oil spiked past $112 a barrel and gas leapt to $4.49. By the old rules, markets should have fallen. Instead they hit records. Defense and energy stocks climbed. And corporate profits, already historically high, kept right on rising.
How high? Since 1990, U.S. corporate profits have grown roughly twelve-fold — from $284 billion to $3.5 trillion. Over the same span, the share of all national wealth held by the top 1% rose from 22.7% to 30.7%. The party, it turns out, is at the very top of the building.
The Numbers — 35 Years of FRED Data
| Indicator | 1990 | Today |
|---|---|---|
| Corporate profits | $284 B | $3,519 B (~12x) |
| Top 1% wealth share | 22.7% | 30.7% |
| Middle class (50–90%) wealth share | 36.4% | 30.4% |
| Labor share of income (index) | 110.7 | 96.7 |
| Productivity vs. real worker pay | +103% vs. +45% | |
| Home prices / healthcare / rent | 3.4x / 3.6x / 3.2x | |
| Wage growth vs. inflation (2026) | 3.57% < 3.95% (real wage negative) | |
All figures from the U.S. Federal Reserve Economic Data (FRED), drawing on BLS, BEA, the Federal Reserve's Distributional Financial Accounts, EIA and the U.S. Census Bureau.
The Middle Class Got Crushed
While capital danced, labor was left holding the bill. Over thirty-five years American workers became 103% more productive — they produced twice as much. Their inflation-adjusted pay rose just 45%. Labor's slice of the national income fell from an index of 110.7 to 96.7. Half the value created never reached the worker's pocket.
The middle class got squeezed from both sides. Its share of the nation's wealth shrank from 36.4% to 30.4% — and the slice it lost went straight to the top. At the same time the price of a secure life exploded: home prices up 3.4x, healthcare 3.6x, rent 3.2x. Against all of that, the real wage barely moved.
Today the math is brutally simple. Wages are rising about 3.57% a year while inflation runs at 3.95%. When pay falls below prices, your paycheck can grow on paper while your buying power erodes every single month. Little wonder that two-thirds of Americans now call inflation the country's biggest problem.
Why Did It Change?
Here we have to be honest: we are not naming a single villain — economists still argue about the causes. But the data is consistent with four suspects.
The Four Suspects (evidence-backed, not a verdict)
- Globalization — production moved to cheaper labor abroad; manufacturing jobs vanished and margins grew.
- Financialization — money flowed into share buybacks and asset prices instead of wages and investment.
- Monopoly power — whole sectors shrank to a handful of giants with the pricing power to pass every cost on to you.
- The decline of unions — workers lost bargaining power, and labor's share fell with it.
These factors move together with rising inequality. Which one is "the" cause is a debate, not a settled fact — so we leave the question open.
Are We Looking in the Wrong Place?
Let's be fair to the data. There is no absolute poverty here. Household incomes rose, unemployment is low, no one is starving. The average family is not poorer than it was in 1990 — it is further behind. The growth was real; it simply wasn't shared. And the cost of a secure, middle-class life — a home, healthcare, an education — became punishing.
So maybe the real story was never the war. With it or without it, this picture doesn't change. The headlines point one way; the data points another.
Don't watch the one crying "crisis" on the screen — watch who just ate. The crocodile weeps when its belly is full. The scale still tips against the person standing on the floor.
Sources
- FRED (Federal Reserve Bank of St. Louis): corporate profits (CP), labor share (PRS85006173), wealth shares (WFRBST01134 / WFRBSN40188), CPI components, wages (LES1252881600Q), home prices (MSPUS) — sourced from BLS, BEA, the Federal Reserve / Distributional Financial Accounts, EIA, and the U.S. Census Bureau.
- EPI (Economic Policy Institute) — the productivity–pay gap.
- Pew Research Center — public sentiment on inflation.
- Reuters / BBC — the February 28, 2026 events and market reaction.
The data is neutral. The verdict is yours. — DunDem News